How to Monitor Error Budget Burn Rates
Cloud engineering teams must balance releasing new features with maintaining reliable services. Error budgets define how much failure a service can tolerate while meeting user expectations. Monitoring burn rates - the speed at which the error budget is consumed - helps identify reliability issues early. Here's a quick breakdown:
- Error Budget Basics: If your SLO is 99.9% availability, the error budget allows for 0.1% failure (e.g., 43.2 minutes of downtime in 30 days). Healthy budgets enable automated feature releases; depleted budgets prioritize fixes.
- Burn Rates Explained: A burn rate of 1.0 means the budget will last exactly through the SLO window. Higher rates (e.g., 14.4x) indicate faster consumption and potential breaches.
- Why It Matters: Burn rate alerts focus on user-facing issues, avoiding false positives from static thresholds. Teams can act before users are impacted.
To monitor burn rates effectively:
- Define SLIs (metrics like success rates) and SLOs (targets for SLIs).
- Use tools like Prometheus, Grafana, or managed solutions like Datadog.
- Set up multi-window alerts for fast and slow burns.
- Build dashboards showing burn rate trends, remaining budgets, and time-to-exhaustion.
Tracking burn rates ensures teams can prevent SLO breaches, maintain service quality, and make data-driven decisions about when to release features or pause changes.
How to Alert on SLOs using Error Budget Burn Rate // DoK Talks #81
sbb-itb-3b7b063
Prerequisites for Monitoring Error Budget Burn Rates
To effectively track how quickly your error budget is being used, you need a solid foundation. This starts with defining what constitutes "good" versus "bad" service behavior and selecting the right tools to measure and alert on these behaviors. Without these steps, your monitoring efforts won’t be reliable.
Define SLOs and SLIs
The first step is identifying your Service Level Indicators (SLIs) - the raw metrics that represent your users' experience. These metrics typically fall into two main categories: availability (whether a request was successful) and latency (how quickly a response was delivered). For each SLI, you’ll need to track two key data points: the total number of eligible events and the number of "good" events that meet your criteria. This ensures your error budget calculations are accurate.
A "good" request isn’t just about success; it also has to meet your latency goals. For example, even an HTTP 200 response should count against your error budget if it takes 2 seconds when your latency target is under 500 milliseconds. Once SLIs are defined, you can establish Service Level Objectives (SLOs) - your reliability targets expressed as percentages over a specific time frame, often a rolling 30-day period. Precise definitions are crucial: a 99.9% SLO allows for only 43.2 minutes of downtime per month, while a 99.99% SLO tightens that to just 4.3 minutes.
"Error budgets... convert 'we should focus on reliability' from an engineering opinion into an organizational fact. When the budget is gone, the data makes the decision." – BackendBytes
Document these definitions in a formal SLO agreement signed by key stakeholders, including engineering, product, and on-call teams. This agreement should also include an Error Budget Policy, which outlines what actions to take when the budget is running low. For example, Google uses deployment gates that automatically block releases if a service’s error budget falls below 25%. With clear SLOs and SLIs in place, you can move on to selecting the tools that will monitor and alert on these metrics.
Select Monitoring and Alerting Tools
The next step is to choose a monitoring stack capable of collecting SLI metrics, calculating burn rates, visualizing trends, and sending alerts. Open-source tools like Prometheus and Grafana are popular choices. Prometheus stores time-series data and supports PromQL queries, while Grafana provides intuitive dashboards. Prometheus recording rules can also pre-calculate error ratios and burn rates, reducing the computational load during alert evaluations.
For managed solutions, Datadog offers native support for metric- and monitor-based SLOs, along with specialized burn rate alerts and integrations with major cloud platforms. Google Cloud Monitoring provides built-in SLO tracking using its select_slo_burn_rate time-series selector. Dynatrace takes monitoring a step further by leveraging its Davis AI to pinpoint root causes of budget depletion and recommend burn rate thresholds based on historical trends.
To maintain consistency across services, consider using OpenTelemetry (OTel) to instrument your applications. OTel allows you to collect SLI metrics - like total and successful request counts - and route them to various monitoring backends through the OTel Collector. Tools such as Sloth or Pyrra can simplify the process by generating complex Prometheus alerting rules from straightforward SLO definitions, minimizing manual errors.
Step-by-Step Guide to Monitoring Error Budget Burn Rates
SLO Targets and Error Budget Breakdown: Downtime Allowances and Failed Request Thresholds
Once your SLOs are defined and monitoring tools are ready, you can begin tracking burn rates. This involves configuring error budgets, gathering metrics, calculating burn rates, setting up alerts, and creating dashboards to keep your team informed about reliability trends.
Step 1: Configure Error Budgets and SLO Targets
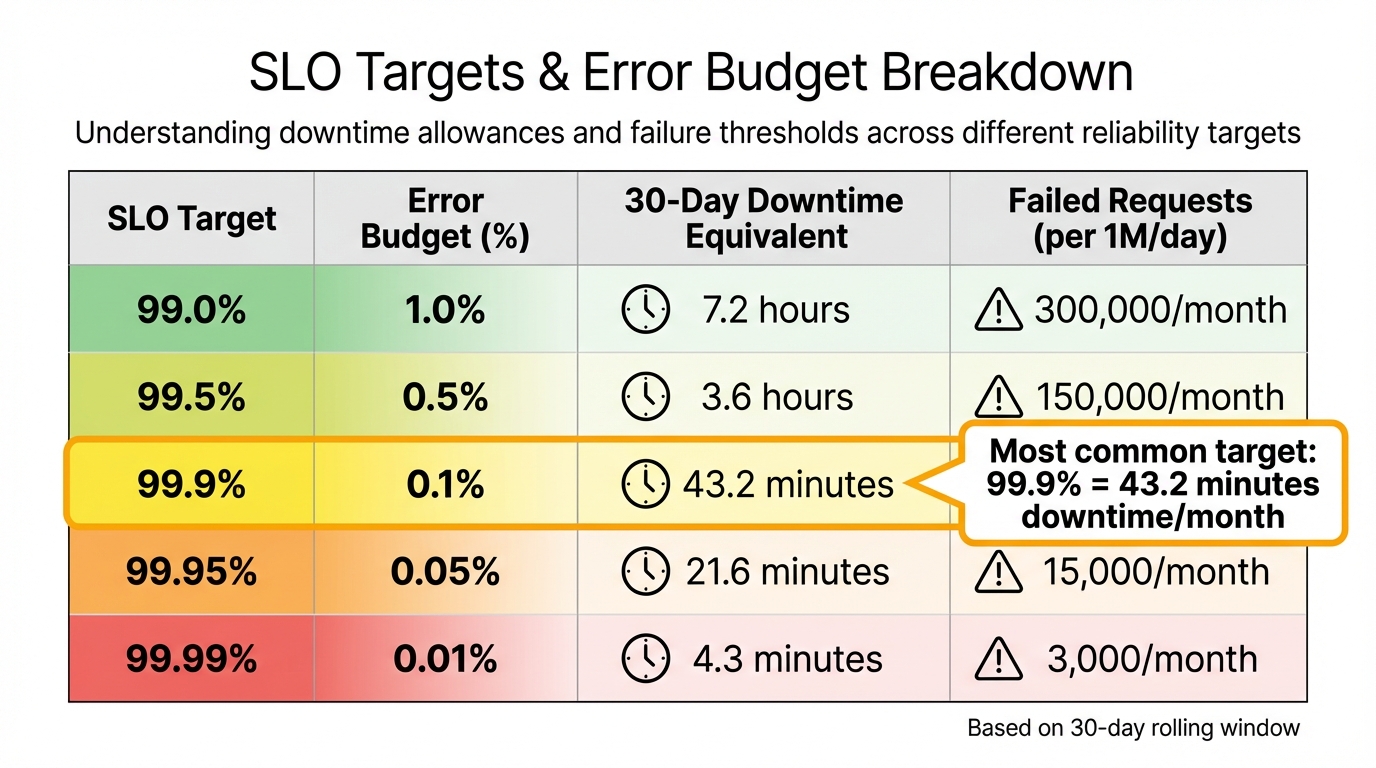
Start by converting your SLO targets into error budgets. For instance, a 99.9% availability SLO translates to a 0.1% error budget, which allows for about 43.2 minutes of downtime in a 30-day period. If your SLO is 99.99%, the budget shrinks to just 4.3 minutes per month. To ease into this process, set initial targets slightly below current performance levels.
Use a rolling 30-day window to track these metrics continuously.
| SLO Target | Error Budget (%) | 30‑Day Downtime Equivalent | Failed Requests (per 1M/day) |
|---|---|---|---|
| 99.0% | 1.0% | 7.2 hours | 300,000/month |
| 99.5% | 0.5% | 3.6 hours | 150,000/month |
| 99.9% | 0.1% | 43.2 minutes | 30,000/month |
| 99.95% | 0.05% | 21.6 minutes | 15,000/month |
| 99.99% | 0.01% | 4.3 minutes | 3,000/month |
Establish tiered responses for specific budget thresholds. For example, when 50% of the budget is used, require additional code reviews. If the budget reaches 0%, implement a feature freeze [1,14]. Automate processes to block deployments when the error budget dips below critical levels using an AI Cloud Engineer.
Step 2: Instrument Metrics and Collect Data
Accurate Service Level Indicator (SLI) data is essential. Instrument your applications to track total and successful requests. Use OpenTelemetry SDKs to create counters such as slo.requests.total, slo.requests.good, and slo.requests.bad [5,9]. A "good" request typically has a non-5xx status code and a response time under a defined threshold (e.g., 300ms).
Leverage an OpenTelemetry Collector with the spanmetrics connector to convert trace data into Prometheus metrics [4,9]. Middleware can help classify requests by service name, HTTP method, and route. Ensure your monitoring backend retains data for the entire SLO window (usually 30 days) to enable accurate calculations [2,10]. Use Prometheus recording rules to pre-calculate request rates and error ratios over various timeframes (e.g., 5 minutes, 1 hour, 30 days) to keep dashboard queries fast [4,10].
Once metrics are collected, you can move on to calculating and tracking burn rates.
Step 3: Calculate and Monitor Burn Rates
Burn rate is calculated as the Observed Error Rate divided by the Allowed Error Rate (1 minus the SLO target) [6,15]. A burn rate of 1.0 means you're consuming your error budget at a steady pace, exhausting it exactly at the end of the 30-day window [2,6]. A burn rate of 14.4x, however, signals a critical issue, as the budget will be depleted in just 2 days [6,15]. Similarly, a burn rate of 6x will use up the budget in about 5 days.
"The burn rate measures how fast you are consuming your error budget relative to a steady‑state consumption." – Nawaz Dhandala, OneUptime
Pre-calculate metrics like slo:error_ratio:5m to reduce processing demands during alert evaluations [4,6]. Google Cloud Monitoring users can use the select_slo_burn_rate time-series selector to retrieve burn rate metrics for alerts. Be sure to include guard clauses (e.g., > 0) in queries to avoid division-by-zero errors for low-traffic services. Define thresholds for fast-burn rates (14.4x or higher) that require immediate action and slower burn rates (1x to 3x) that indicate gradual degradation needing attention [6,15].
Step 4: Set Up Alerts for Burn Rate Thresholds
Multi-window alerting helps you detect genuine issues while ignoring temporary spikes. Alerts should trigger only when both a longer time window (to confirm sustained impact) and a shorter window (to ensure the issue persists) exceed the burn rate threshold [2,6]. This strategy reduces false positives to below 5% while ensuring actual incidents are caught.
Set up tiered alert severity levels based on burn rate thresholds and timeframes:
| Severity | Burn Rate Threshold | Long Window | Short Window | Budget Consumed | Exhaustion Time |
|---|---|---|---|---|---|
| Critical (Page) | 14.4x | 1 hour | 5 minutes | 2% | ~2 days |
| Critical (Page) | 6x | 6 hours | 30 minutes | 5% | ~5 days |
| Warning (Ticket) | 3x | 1 day | 2 hours | 10% | ~10 days |
| Info (Ticket) | 1x | 3 days | 6 hours | 10% | ~30 days |
Send urgent fast-burn alerts to paging systems like PagerDuty, while routing slower alerts to ticketing systems or Slack. Use your monitoring platform's routing tools or Alertmanager to ensure notifications reach the right teams.
With alerts configured, the next step is to visualize these metrics effectively.
Step 5: Build Burn Rate Dashboards
Dashboards should clearly display burn rate trends, remaining error budgets, and critical SLIs. Include a "Time Until Budget Exhaustion" panel to show when the SLO is likely to be breached at the current consumption rate [4,9].
Add annotations to highlight deployments, feature flag changes, and other events that might explain budget spikes [4,10]. Organize the dashboard into sections showing the current burn rate, historical trends over the last 30 days, and a breakdown of errors contributing to budget usage. Include panels for both the remaining error budget and its consumption rate across multiple timeframes (e.g., 1 hour, 6 hours, 1 day, 3 days). This layered view helps differentiate between short-term anomalies and longer-term reliability concerns that demand action.
Best Practices for Monitoring and Managing Burn Rates
Once your monitoring tools and dashboards are set up, the next step is to manage error budget burn rates effectively. Here are some actionable practices to help you stay ahead of potential issues.
Set Clear Alerting Policies
Create tiered alert levels that correspond to specific burn rates and direct these alerts to the appropriate response channels. For example:
- Critical alerts (e.g., a 14.4x burn rate, which could deplete your budget in about 2 days) should go to on-call teams via paging systems.
- High-priority alerts (e.g., a 6x burn rate, potentially exhausting the budget in 5 days) should be routed to team leads.
- Moderate alerts (e.g., 3x or 1x burn rates) can be sent to ticketing systems for review.
"The goal is every alert representing real user impact that requires human intervention." – Nawaz Dhandala, Author, OneUptime
Design alerts to reflect actual business impact by focusing on the rate of budget consumption rather than using arbitrary thresholds. For instance, you could integrate error budget levels into deployment policies, such as pausing changes if the budget falls below 25%.
Review Historical Burn Rate Trends
Regularly examine the rate of budget depletion shown in your dashboards. A steady, gradual decline typically signals normal operations, while sudden sharp drops may indicate incidents that need immediate investigation. Use timeline annotations to link significant budget drops to system changes or events .
Dive into historical data to pinpoint which services, routes, or endpoints are consuming the most budget - these are your primary "budget burners." Use this information to prioritize reliability improvements . Additionally, analyze false positives in your alerts. If brief spikes resolve without intervention, consider tweaking window durations to improve the signal-to-noise ratio. Keep stakeholders informed with weekly reports summarizing the remaining budget, current consumption rates, and projected exhaustion dates.
By analyzing trends and patterns, you can fine-tune your monitoring strategies to keep pace with changing service demands.
Refine Monitoring Systems Over Time
Start by setting realistic SLOs that align with your current performance. For example, if your system operates at 99.5%, don’t aim for 99.99% right away. Instead, set a slightly lower target to allow for smoother adjustments . Conduct weekly reviews to identify major areas of budget consumption and evaluate whether reliability is improving or declining.
As your system becomes more reliable or user expectations shift, gradually tighten SLO targets to push for better performance. Tailor the monitoring strictness based on the importance of each service. For example, a checkout process might need stricter SLOs compared to an internal admin tool. Periodically inject errors into the system to test the entire alerting chain, ensuring that detection and notification processes work as intended.
"Error budget policies turn SLOs from passive measurements into active governance tools." – Nawaz Dhandala, Author
Conclusion
Keeping an eye on error budget burn rates shifts the focus from fixing problems after they occur to preventing them in the first place. Instead of waiting for systems to fail, burn rate alerts help teams spot issues early. These examples emphasize why tracking burn rates before budgets are fully depleted is so crucial.
By following the outlined metrics and monitoring steps, and using tools like OpenTelemetry, Prometheus, and Grafana with multi-window alerting, teams can create a centralized reliability dashboard. This approach replaces guesswork with clear, actionable insights - allowing teams to confidently roll out features when the error budget is in good shape and automatically halt non-critical changes when it dips below 25%.
"Knowing your error budget exists is not enough. You need to see it burning in real time so you can react before it is gone." – Nawaz Dhandala, Author, OneUptime
Regular reviews and analyzing historical trends are essential for maintaining the right balance between feature development and system reliability. Weekly reviews help pinpoint the biggest drains on the error budget, while historical data shows whether reliability is improving or slipping. As systems grow and change, SLOs and alerting thresholds should adapt too, creating a dynamic environment where speed and reliability naturally align.
Tools like Kanu AI simplify this process by automating the monitoring and validation of error budgets. This continuous automation not only reinforces system resilience but also helps teams make steady progress in improving service reliability.
FAQs
How do I pick the right SLI and SLO for my service?
To select the right SLI (Service Level Indicator) and SLO (Service Level Objective), prioritize metrics that directly represent your service's performance and the user experience. Key examples include success rates and latency.
When setting SLO targets, use a combination of historical data, user expectations, and business objectives to guide your decisions. It's important to revisit and refine these targets regularly. This ensures they remain aligned with any updates to your service and strike the right balance between maintaining reliability and delivering new features.
What burn rate thresholds should we alert on?
Alert thresholds for burn rates are closely tied to your error budget and SLO (Service Level Objective) policies. The goal is to catch unsustainable error budget consumption before it leads to an SLO breach.
Typically, thresholds are set at values like 1.0 or higher, which helps identify rapid consumption early. To avoid unnecessary alerts or false positives, many teams use multi-window analysis, comparing burn rates over different time frames.
When setting thresholds, it's important to consider both historical data and your organization's risk tolerance. This ensures the alerts are both practical and aligned with your operational priorities.
How do I handle burn rate alerts for low-traffic services?
To keep tabs on burn rates for low-traffic services, consider using multi-window error budget burn rate alerting. This method helps alert on-call engineers early - before the error budget runs out - even when traffic levels are low.
You can set up these multi-window alerts by leveraging metrics tools like OpenTelemetry. These tools track error budget consumption over various timeframes, helping to minimize false alarms while maintaining the right level of urgency. This makes it especially useful for services with inconsistent or minimal traffic.