
AI-Driven Debugging for Faster Cloud Systems
AI is transforming how cloud systems are debugged. Traditional debugging, which often takes hours or days, is being replaced by AI-powered tools that identify root causes in seconds. These tools analyze logs, metrics, and traces, enabling faster issue resolution and improved system performance.
Key takeaways:
- AI reduces debugging time by up to 90%, as demonstrated by Databricks in 2025.
- Mean Time to Resolution (MTTR) can drop by 70%.
- Predictive capabilities allow teams to address issues before they escalate.
- Real-time analysis pinpoints problems like latency spikes, resource mismanagement, and log overload.
For instance, platforms like Kanu AI automate the debugging process, from identifying errors to deploying fixes, ensuring production-ready systems with minimal manual intervention. These advancements not only save time but also enhance reliability and efficiency in cloud operations.
How an AI Agent Debugged a Production Incident in 80 Seconds (For 60 Cents)
Common Performance Bottlenecks in Cloud Systems
Cloud systems often show signs of performance decline long before outright failure. Issues like storage latency, compute saturation, and log overload can eat into budgets, frustrate users, and lead to reactive troubleshooting. Understanding these bottlenecks is key to addressing them effectively. Let’s dive into the main culprits that hinder system performance and how they typically manifest.
Latency in Distributed Systems
Distributed systems are only as efficient as their slowest component. When service-to-service calls happen sequentially instead of in parallel, delays snowball. In synchronous systems, even one underperforming node - often called a "straggler" - can leave thousands of other components idle, waiting for it to catch up.
A striking example comes from August 2025, when Magic, an AI company, faced a 40-hour performance drop across 8,000 GPUs due to a single straggler node. The slowdown caused a 60% to 70% drop in overall performance. Eric Steinberger, Magic's Co-founder and CEO, explained:
"Magic's hero workload running across 8,000 GPUs was experiencing severe performance degradation over a period of 40 hours... Google's automated straggler detection was able to identify straggler nodes... We now have straggler detection enabled by default."
These delays can stem from both hardware issues and inefficient execution. For instance, queueing delays - where requests wait for resources to become available - can add hundreds of milliseconds to response times. Fortunately, adjustments like increasing connection pool sizes can often reduce these delays significantly.
While latency is often tied to execution inefficiencies, poor resource management can also play a major role in degrading performance.
Resource Allocation Problems
Managing cloud resources efficiently is a balancing act, and missteps can lead to wasted budgets and underwhelming performance. Studies show that engineering teams leave as much as 40% of their cloud budgets unutilized due to idle capacity or configuration errors.
Storage bottlenecks are a common pain point. For example, older AWS gp2 volumes face "performance cliffs" when burst credits run out, causing a sharp drop in speed. Similarly, database performance can take a significant hit when the BufferCacheHitRatio dips below 90%, forcing the system to read from disk instead of memory - a much slower process.
Auto-scaling issues add another layer of complexity. When scaling policies lag behind demand, new instances often join too late to handle traffic spikes, leading to "cold start" latency. The solution isn’t always about throwing more resources at the problem. Smarter configurations, like switching from gp2 to gp3 volumes on AWS, can reduce costs by about 20% per GiB while allowing separate scaling of IOPS and throughput.
Log and Metric Data Overload
Modern cloud systems generate an overwhelming amount of logs and metrics, often across hundreds of microservices. This sheer volume makes manual analysis nearly impossible. Scanning metrics across thousands of nodes can take hours, if not days. Sophie Lebrecht, COO at the Allen Institute for AI, highlighted this challenge:
"Previously, our teams wasted precious cycles trying to pinpoint the exact source of a node and/or GPU failure during our lengthy training runs... Straggler detection on GCP was a big productivity boost."
Excessive log verbosity not only complicates debugging but also drives up storage and analysis costs. The irony? Higher costs don’t necessarily mean faster problem resolution. Traditional monitoring tools often provide aggregate metrics that confirm slowdowns but fail to pinpoint their root cause. Fail-slow issues, where components operate at reduced performance due to problems like thermal throttling or software bugs, are especially tricky. These issues can drag down the entire system, particularly in synchronous setups. Without automated tools, identifying these problems often requires manually correlating metrics from thousands of nodes - a process that can stretch from minutes to days.
The growing complexity of cloud environments underscores the need for smarter, AI-driven tools to simplify debugging and optimize performance.
AI Tools and Methods for Cloud Debugging
AI Detection Methods and Performance Gains for Cloud System Bottlenecks
AI tools have transformed cloud debugging by automating tasks that once required hours of manual investigation. These tools not only flag issues but also trace their origins across sprawling cloud environments. By leveraging AI, engineers can quickly understand why problems occur and how to resolve them.
Anomaly Detection and System Profiling
AI debugging employs techniques like causal analysis and real-time network graphing to separate root causes from surface-level symptoms. For example, tools that monitor network traffic create communication graphs and use graph-traversal algorithms to trace dependencies, pinpointing bottlenecks with precision. In Java applications, AI pipelines analyze thread dumps using large language models (LLMs), identifying bottlenecks in seconds.
Dimension analysis further enhances troubleshooting by comparing anomaly periods against baseline data. This method evaluates variables like service names, pods, and status codes to rank which factors best explain performance changes. Ashish Kolhe, Head of Engineering at OpenObserve, explained the challenge:
"The real question is: What changed, and where? ... finding the root cause means diving into a maze of manual queries... Insights automatically selects the most relevant dimensions based on your data schema".
Visual Analysis of Metrics and Logs
Visual tools simplify massive amounts of telemetry data, turning it into actionable insights. Interactive dashboards let engineers isolate latency spikes and initiate automated analyses, cutting manual query times from 30 minutes to under a minute.
AI also correlates deployment history, configuration changes, and telemetry data to identify what changed and who made the change during an incident. In August 2025, ZoomInfo incorporated AI-driven investigation tools into their workflow. DevOps Engineer Yasin Senturk noted that these tools empowered engineers of all skill levels to diagnose complex infrastructure issues, reducing resolution times from hours to minutes. Marija Naumovska, Co-Founder at Microtica, highlighted the benefits:
"AI-powered analysis filters out noise, highlights what matters, and helps platform teams operate with clarity and speed".
These visual tools not only streamline debugging but also pave the way for measuring and comparing performance improvements across various bottleneck types.
Bottleneck Types, Detection Methods, and Performance Gains
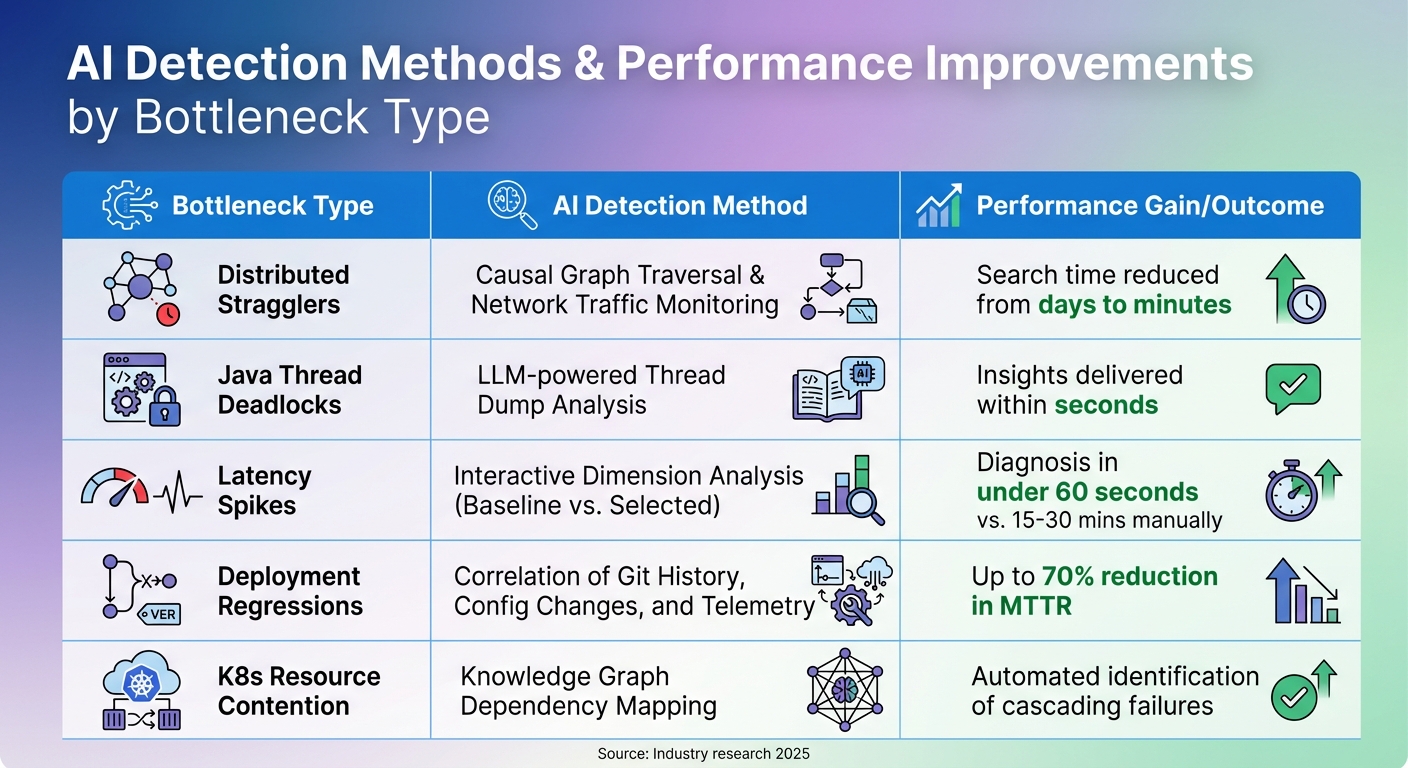
Different bottlenecks require specific AI approaches. Here's a summary of detection methods and the typical performance improvements they deliver:
| Bottleneck Type | AI Detection Method | Typical Performance Gain / Outcome |
|---|---|---|
| Distributed Stragglers | Causal Graph Traversal & Network Traffic Monitoring | Search time reduced from days to minutes |
| Java Thread Deadlocks | LLM-powered Thread Dump Analysis | Insights delivered within seconds |
| Latency Spikes | Interactive Dimension Analysis (Baseline vs. Selected) | Diagnosis in under 60 seconds vs. 15–30 mins manually |
| Deployment Regressions | Correlation of Git History, Config Changes, and Telemetry | Up to 70% reduction in MTTR |
| K8s Resource Contention | Knowledge Graph Dependency Mapping | Automated identification of cascading failures |
Advanced systems use knowledge graphs to map entire Kubernetes or cloud environments, creating dynamic models of resources and their relationships. This allows AI to detect cascading failure modes. Additionally, natural language interpretation translates cryptic errors like ImagePullBackOff into clear, actionable steps. By enriching traces with metadata - such as function names, file paths, and commit SHAs - AI tools achieve greater precision in identifying and resolving issues.
How Kanu AI Automates Cloud Debugging
Kanu AI takes cloud debugging to the next level by fully automating the process from start to finish. Acting like an AI-driven Cloud Engineer within your AWS account, it manages the entire delivery loop to ensure your system is production-ready. By diving into logs, metrics, and traces, Kanu delivers more precise failure diagnoses than traditional static code analysis ever could.
Automated Log and Metric Analysis
When Kanu deploys a system, its QA Agent runs an impressive 250 live validation checks. These checks examine real endpoints and actual data paths, catching issues that static analysis tools often overlook. If something fails, Kanu doesn’t just notify you - it identifies the root cause. This streamlined process speeds up delivery by 80%, cutting the time from initial requirements to production compared to manual debugging workflows.
Agent-Based Debugging Workflow
Kanu uses three specialized agents - Intent, DevOps, and QA - that work together to automate the entire debugging cycle:
- Intent Agent: Manages delivery specifications and flags tradeoffs that may require human input.
- DevOps Agent: Implements changes using tools like Terraform, CDK, or CloudFormation, adapting based on deployment signals.
- QA Agent: Validates the system, triggers fixes when needed, and ensures everything works as expected.
As Kanu explains:
"No pull request is created until the system works in your environment."
This collaboration between agents ensures a seamless and thorough debugging process that sets Kanu apart in cloud automation.
Real-Time Error Detection and Fix Deployment
Kanu doesn’t stop at detection - it fixes issues in real-time. When an error is found, Kanu enters a fix loop, analyzing logs, updating code and infrastructure, and redeploying until every validation check passes. This entire process happens automatically within your cloud account, ensuring no data leaves your environment. Plus, with full SOC 2 Type II compliance, you can trust the platform’s security. A pull request is only created once the system has been validated in a live environment, guaranteeing that every PR reflects production-ready software.
sbb-itb-3b7b063
Step-by-Step AI Debugging Process
When a cloud system slows down or fails, AI-driven debugging simplifies the process, transforming hours of manual troubleshooting into a streamlined workflow. By moving from data collection to analysis and rapid fixes, AI pinpoints root causes in just minutes.
Gather System Data
Effective AI debugging begins with the "three pillars" of observability: structured logs (in JSON format), numeric time-series metrics, and distributed traces via OpenTelemetry. To give AI the clearest picture of system behavior, focus on capturing the "Golden Signals":
- Latency: Percentiles like p50, p95, and p99.
- Traffic: Requests per second.
- Errors: Failure rates.
- Saturation: Metrics like CPU usage, memory, and queue depth.
Using tail-based sampling helps prioritize high-value failure traces while reducing storage costs. To further enhance telemetry, include code-aware context such as function names, file paths, line numbers, and commit SHAs. This metadata enables AI to map runtime errors directly to the source code. Logs should be emitted in JSON format with stable keys and correlation IDs to allow seamless AI correlation.
This rich dataset forms the foundation for AI to detect even the most subtle system deviations.
Identify Anomalies and Bottlenecks
Once the data is collected, AI dives into analysis, uncovering patterns and anomalies. By employing intelligent grouping, AI consolidates thousands of redundant log lines into distinct failure patterns, cutting investigation time from hours to just 20 minutes. Tools like "Code Graphs" map runtime evidence to code structure, tracking relationships such as function calls, inheritance chains, and code change histories.
A critical part of this process is identifying "Divergence Points" - moments where system behavior strays from expected norms. AI’s telemetry analysis proves accurate around 80% of the time in pinpointing root causes. Predictive debugging adds another layer by spotting early warning signs, such as gradual memory increases or latency trends, before they escalate into major issues. As Alexander Godwin from LogRocket explains:
"AI-first debugging is ultimately about supporting human judgment, not removing it".
With anomalies identified, the focus turns to implementing targeted solutions.
Implement and Test Solutions
Armed with root cause insights, AI develops causal hypotheses that link specific code changes or configurations to the observed issue. Using techniques like "delta debugging", AI generates deterministic reproducers, converting production traces into minimal failing tests by removing irrelevant inputs. This ensures the smallest test case still demonstrates the bug.
Fixes are validated in controlled environments, such as hermetic sandboxes - isolated setups like Firecracker microVMs or hardened containers where variables like time, randomness, and I/O are strictly managed. This approach ensures that fixes are effective and don’t introduce new issues. As DebuggAI puts it:
"If an incident only produces a Slack thread and a retrospective, it depreciates. If it produces a deterministic, minimal test... it becomes an investment".
Advanced AI Techniques for Performance Optimization
Building on reactive AI debugging methods, newer approaches now focus on proactively optimizing performance. These techniques analyze patterns, predict potential failures, and automatically adjust infrastructure to prevent issues before users experience any disruptions.
Predictive Issue Detection
AI tools have become adept at spotting trouble before it happens. By monitoring metrics like latency, memory usage, and error rates, these systems can send alerts before thresholds are crossed. Instead of relying solely on static thresholds, AI establishes baselines for normal behavior and flags subtle deviations - such as increasing network latency or frequent pod restarts - that might otherwise go unnoticed.
An example of this is straggler detection, which identifies underperforming nodes that can drag down overall system performance by as much as 60-70%. With causal analysis, AI can determine whether a node is slow because of external dependencies or if it is the root cause of the slowdown. By analyzing network traffic and mapping node interactions in real time, AI tools use graph-traversal algorithms to trace how performance issues spread. These systems can recognize over 20 Kubernetes issue patterns, such as CrashLoopBackOff or OOMKilled, within just 30 seconds of their onset.
Once potential problems are identified, AI quickly zeroes in on their source.
Automated Root Cause Identification
When incidents occur, AI takes the guesswork out of troubleshooting by correlating deployment history, configuration changes, logs, and telemetry data to pinpoint the cause of failures. This approach dramatically reduces investigation time - by as much as 90%.
Large language models (LLMs) play a critical role here, using semantic clustering to group thousands of repetitive log entries into a single, actionable failure pattern. This cuts investigation time from around two hours to just 20 minutes. For example, in August 2025, Yasin Senturk, a DevOps Engineer at ZoomInfo, used Gemini Cloud Assist to resolve complex infrastructure issues in minutes - tasks that previously took hours.
AI also simplifies troubleshooting by providing clear, natural-language explanations. This empowers junior engineers to handle issues that once required senior-level expertise. As Marija Naumovska, Co-Founder at Microtica, aptly said:
"DevOps with AI is real-time, root-cause-aware, and resilient. DevOps without AI? Still guessing, still blind."
Integration with Infrastructure as Code
AI debugging tools now integrate directly with Infrastructure as Code (IaC) platforms like Terraform, optimizing configurations during the CI/CD process. These systems scan IaC scripts to identify security risks, inefficiencies, or deviations from best practices before deployment.
Self-healing infrastructure is no longer a distant goal. AI can detect misconfigurations or performance bottlenecks in real time and trigger automated updates to IaC scripts to fix the problem. By analyzing historical data and performance metrics, AI predicts future needs, enabling preemptive adjustments to resources like compute, storage, and networking before bottlenecks occur.
Modern AI tools also incorporate cost analysis, showing the financial impact of infrastructure changes. For instance, they can calculate how increasing database memory might affect monthly cloud costs. Tools like Kanu AI act as virtual cloud engineers, generating Terraform or CloudFormation code, applying updates, and iterating until the system performs as expected - all while maintaining security and compliance within your environment.
This seamless integration ensures that infrastructure stays optimized and ready for production, balancing performance, cost, and operational control.
Conclusion
AI-driven debugging is reshaping how developers tackle performance issues in cloud systems. Instead of spending hours sifting through endless log files, developers can now rely on AI-generated summaries and high-level hypotheses that pinpoint root causes. This shift reduces the initial investigation time from one to two hours to just about 20 minutes.
The impact on productivity is hard to ignore. Debugging tasks, which often take up 35% to 50% of a developer’s time, can be reduced by as much as 90% with AI-powered platforms. This means teams can resolve issues faster and dedicate more energy to building new features.
But it’s not just about speed. AI automation also makes operations more proactive. Predictive debugging can catch subtle latency trends early, giving teams the chance to address problems before users even notice. By understanding system architecture and applying expert knowledge, these tools guide teams toward effective solutions.
The long-term value of AI in debugging lies in its ability to learn and grow with the team. Over time, AI agents adapt to team workflows and system-specific behaviors, preserving critical insights as systems scale. For example, at Databricks, even new engineers with no prior context could dive into complex database investigations in under five minutes.
The benefits extend beyond debugging. Tools like Kanu AI integrate these capabilities directly into the software delivery process, automating tasks like code generation, validation, and actionable insights. This allows teams to deploy production-ready code faster, all while maintaining strong security and control.
FAQs
What data do I need to enable AI debugging in the cloud?
To make AI debugging work in the cloud, you need key data that gives a clear picture of the system and its runtime environment. This includes:
- Distributed traces and telemetry: These track how requests move through different services, helping to pinpoint where issues arise.
- Code graphs and change history: These reveal dependencies between components and highlight recent changes that could be causing problems.
- Test replays and reproductions: These allow you to recreate failures, making it easier to identify the root cause.
- Logs and metrics: These capture system behavior and performance, offering valuable insights into what went wrong.
With this data, AI tools can effectively analyze and resolve even the trickiest issues.
How does AI pinpoint the root cause across microservices?
AI helps pinpoint root causes in microservices by examining system-wide traces, change logs, and telemetry data to reveal how different components interact. By analyzing distributed traces, service dependencies, and recent updates, it formulates hypotheses, which are then tested using deterministic replays to confirm accuracy. Additionally, large language models assist teams in navigating the intricate web of dependencies, making it easier to identify underlying issues instead of just addressing symptoms. This approach minimizes downtime and streamlines troubleshooting in cloud-based systems.
How can AI debugging reduce costs, not just MTTR?
AI debugging helps cut costs in more ways than just reducing Mean Time to Resolution (MTTR). By automating the process of identifying and resolving issues, it streamlines resource usage and reduces the need for manual labor. This approach not only speeds up fixes but also improves the accuracy of root cause analysis, preventing the same problems from cropping up again.
The result? Less downtime, fewer wasted resources, and lower operational expenses. At the same time, it boosts system reliability and keeps customers happier by ensuring smoother operations.